Education
📊 Bar chart: Comparing the average percentages of income spending in two years which are fifty years apart
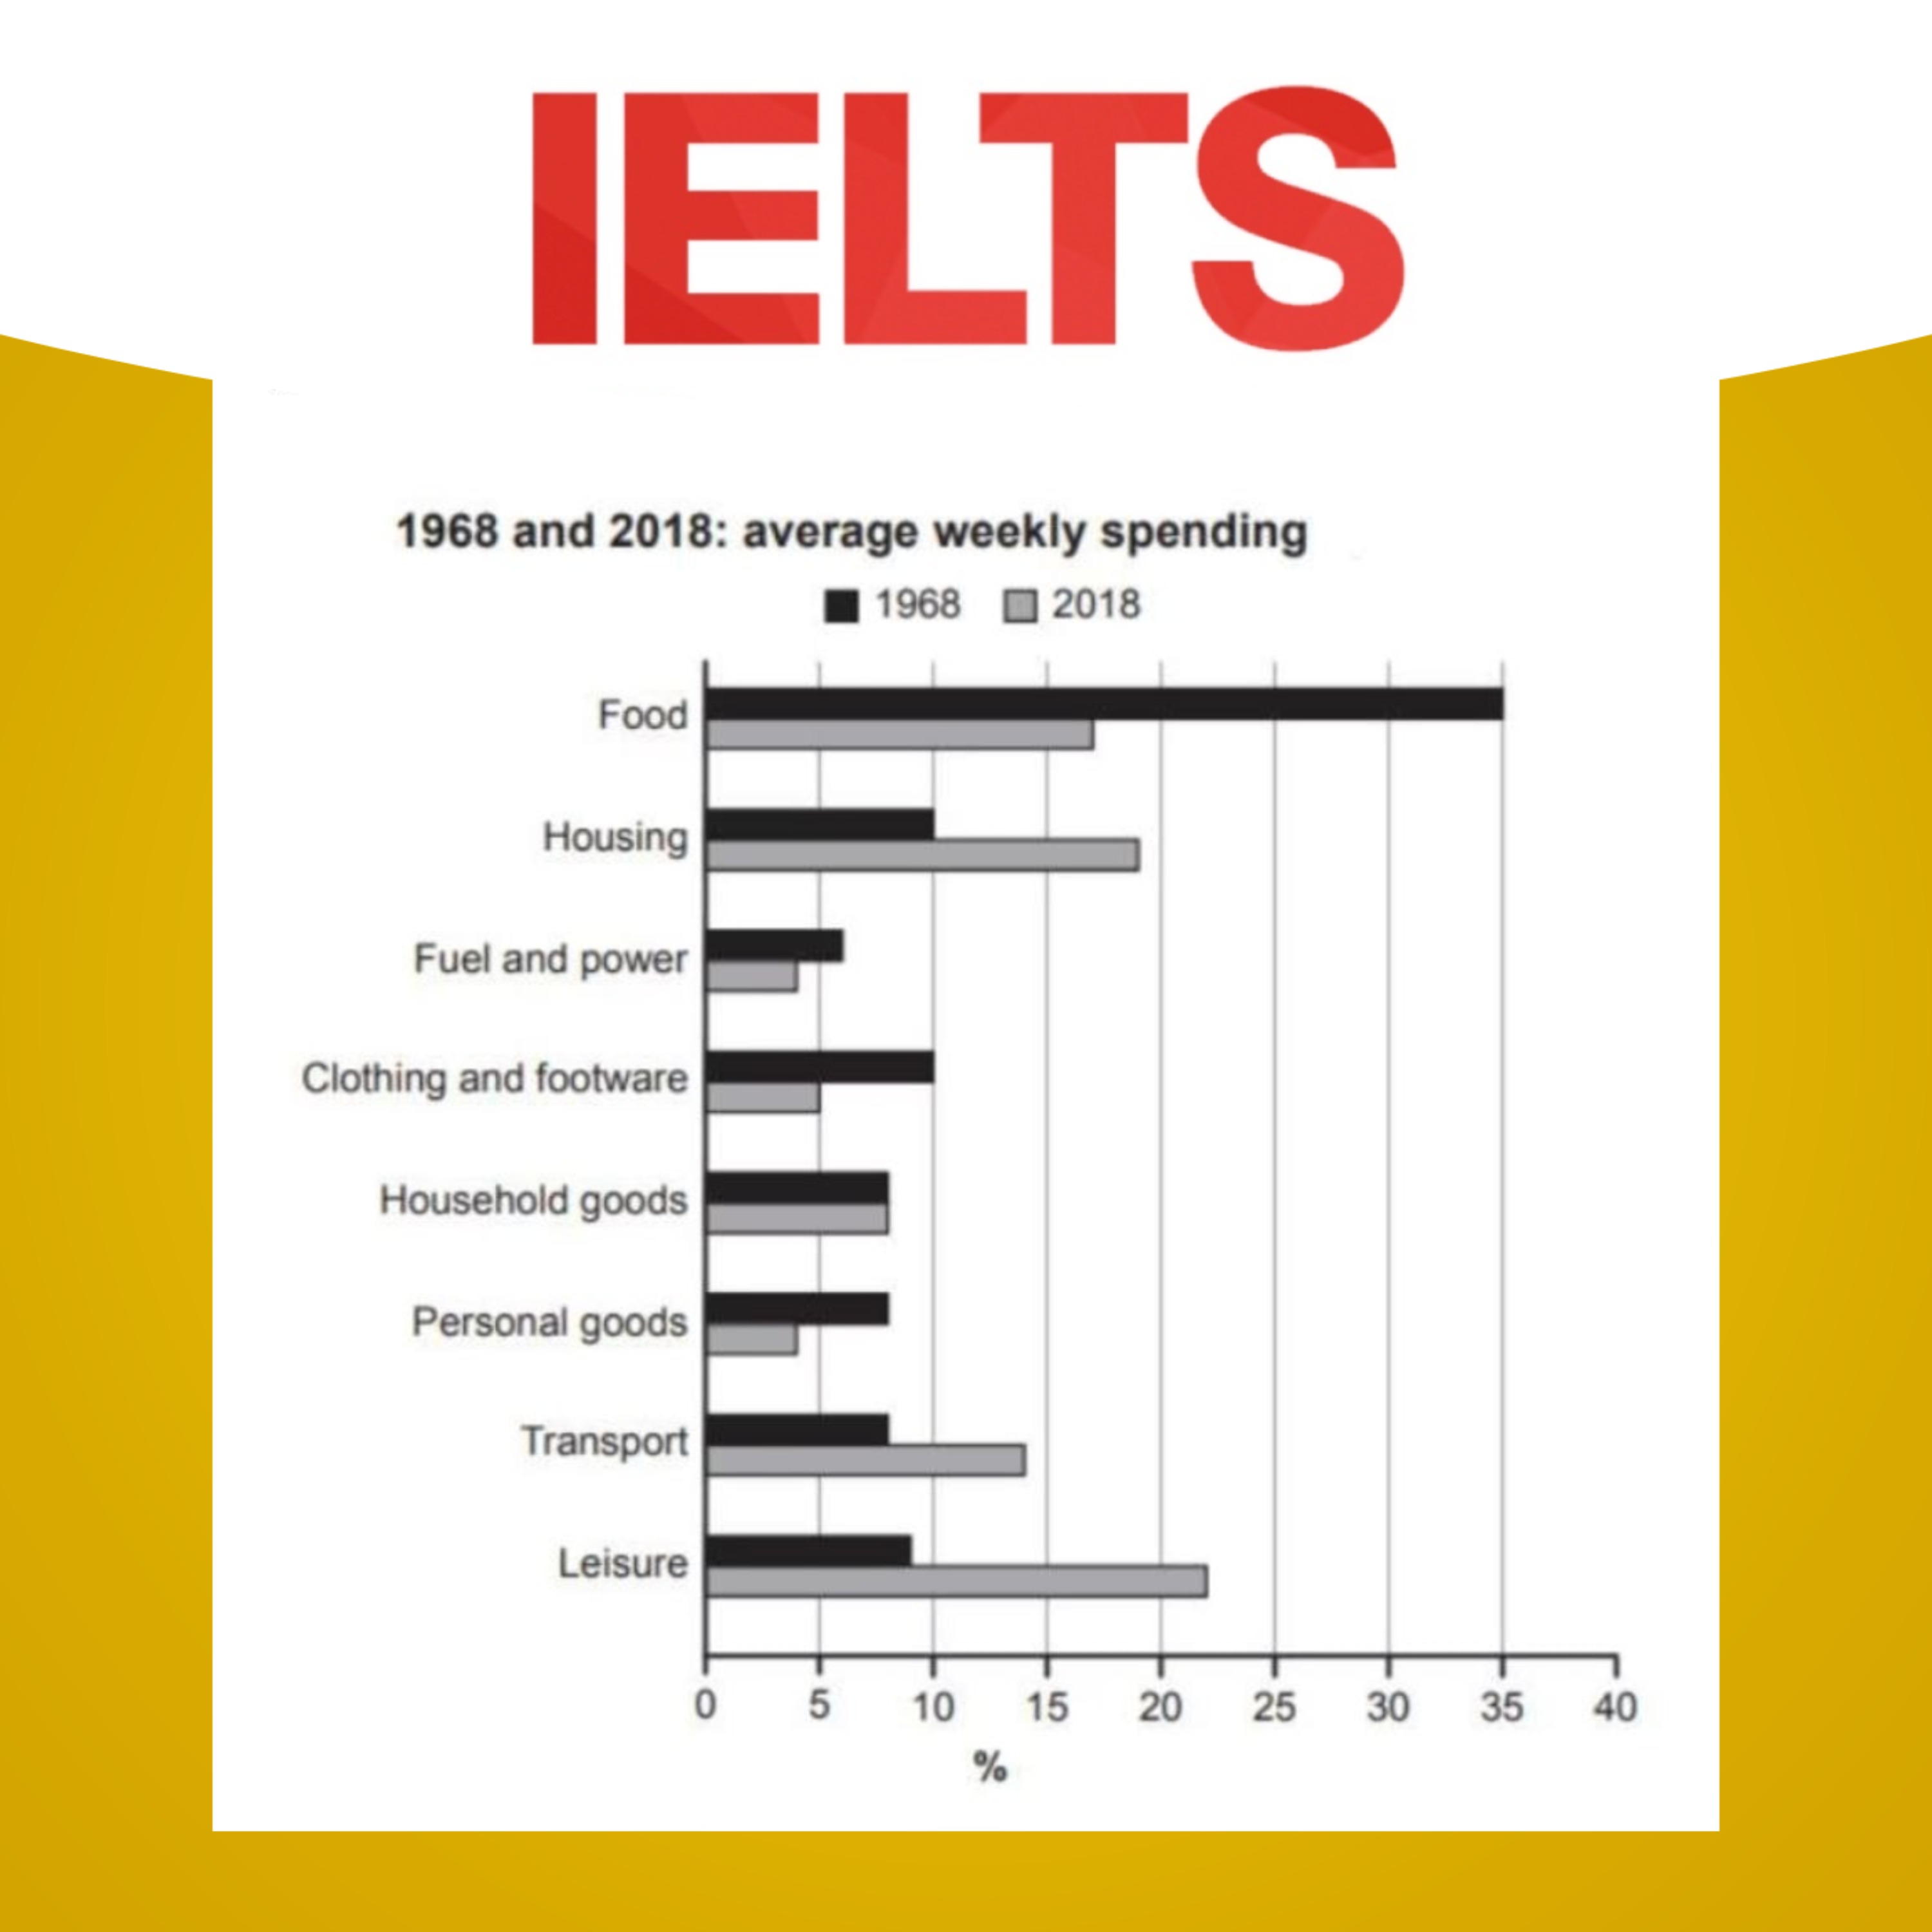
The bar chart provides information about how families in a country spent weekly income in both 1968 and 2018. Summaries the information by selecting and reporting the main features, and make comparisons where relevant. W...
About This Episode
📊 Bar chart: Comparing the average percentages of income spending in two years which are fifty years apart is an episode from IELTS Writing for Success by Success with IELTS. The bar chart provides information about how families in a count...
Podcast
This episode belongs to IELTS Writing for Success.
Listen Online
Use the player on this page to stream the episode online.
Episode Details
Published Sep 12, 2022, 4:14 long, audio available.
Related Episodes
Continue listening to more episodes from IELTS Writing for Success.
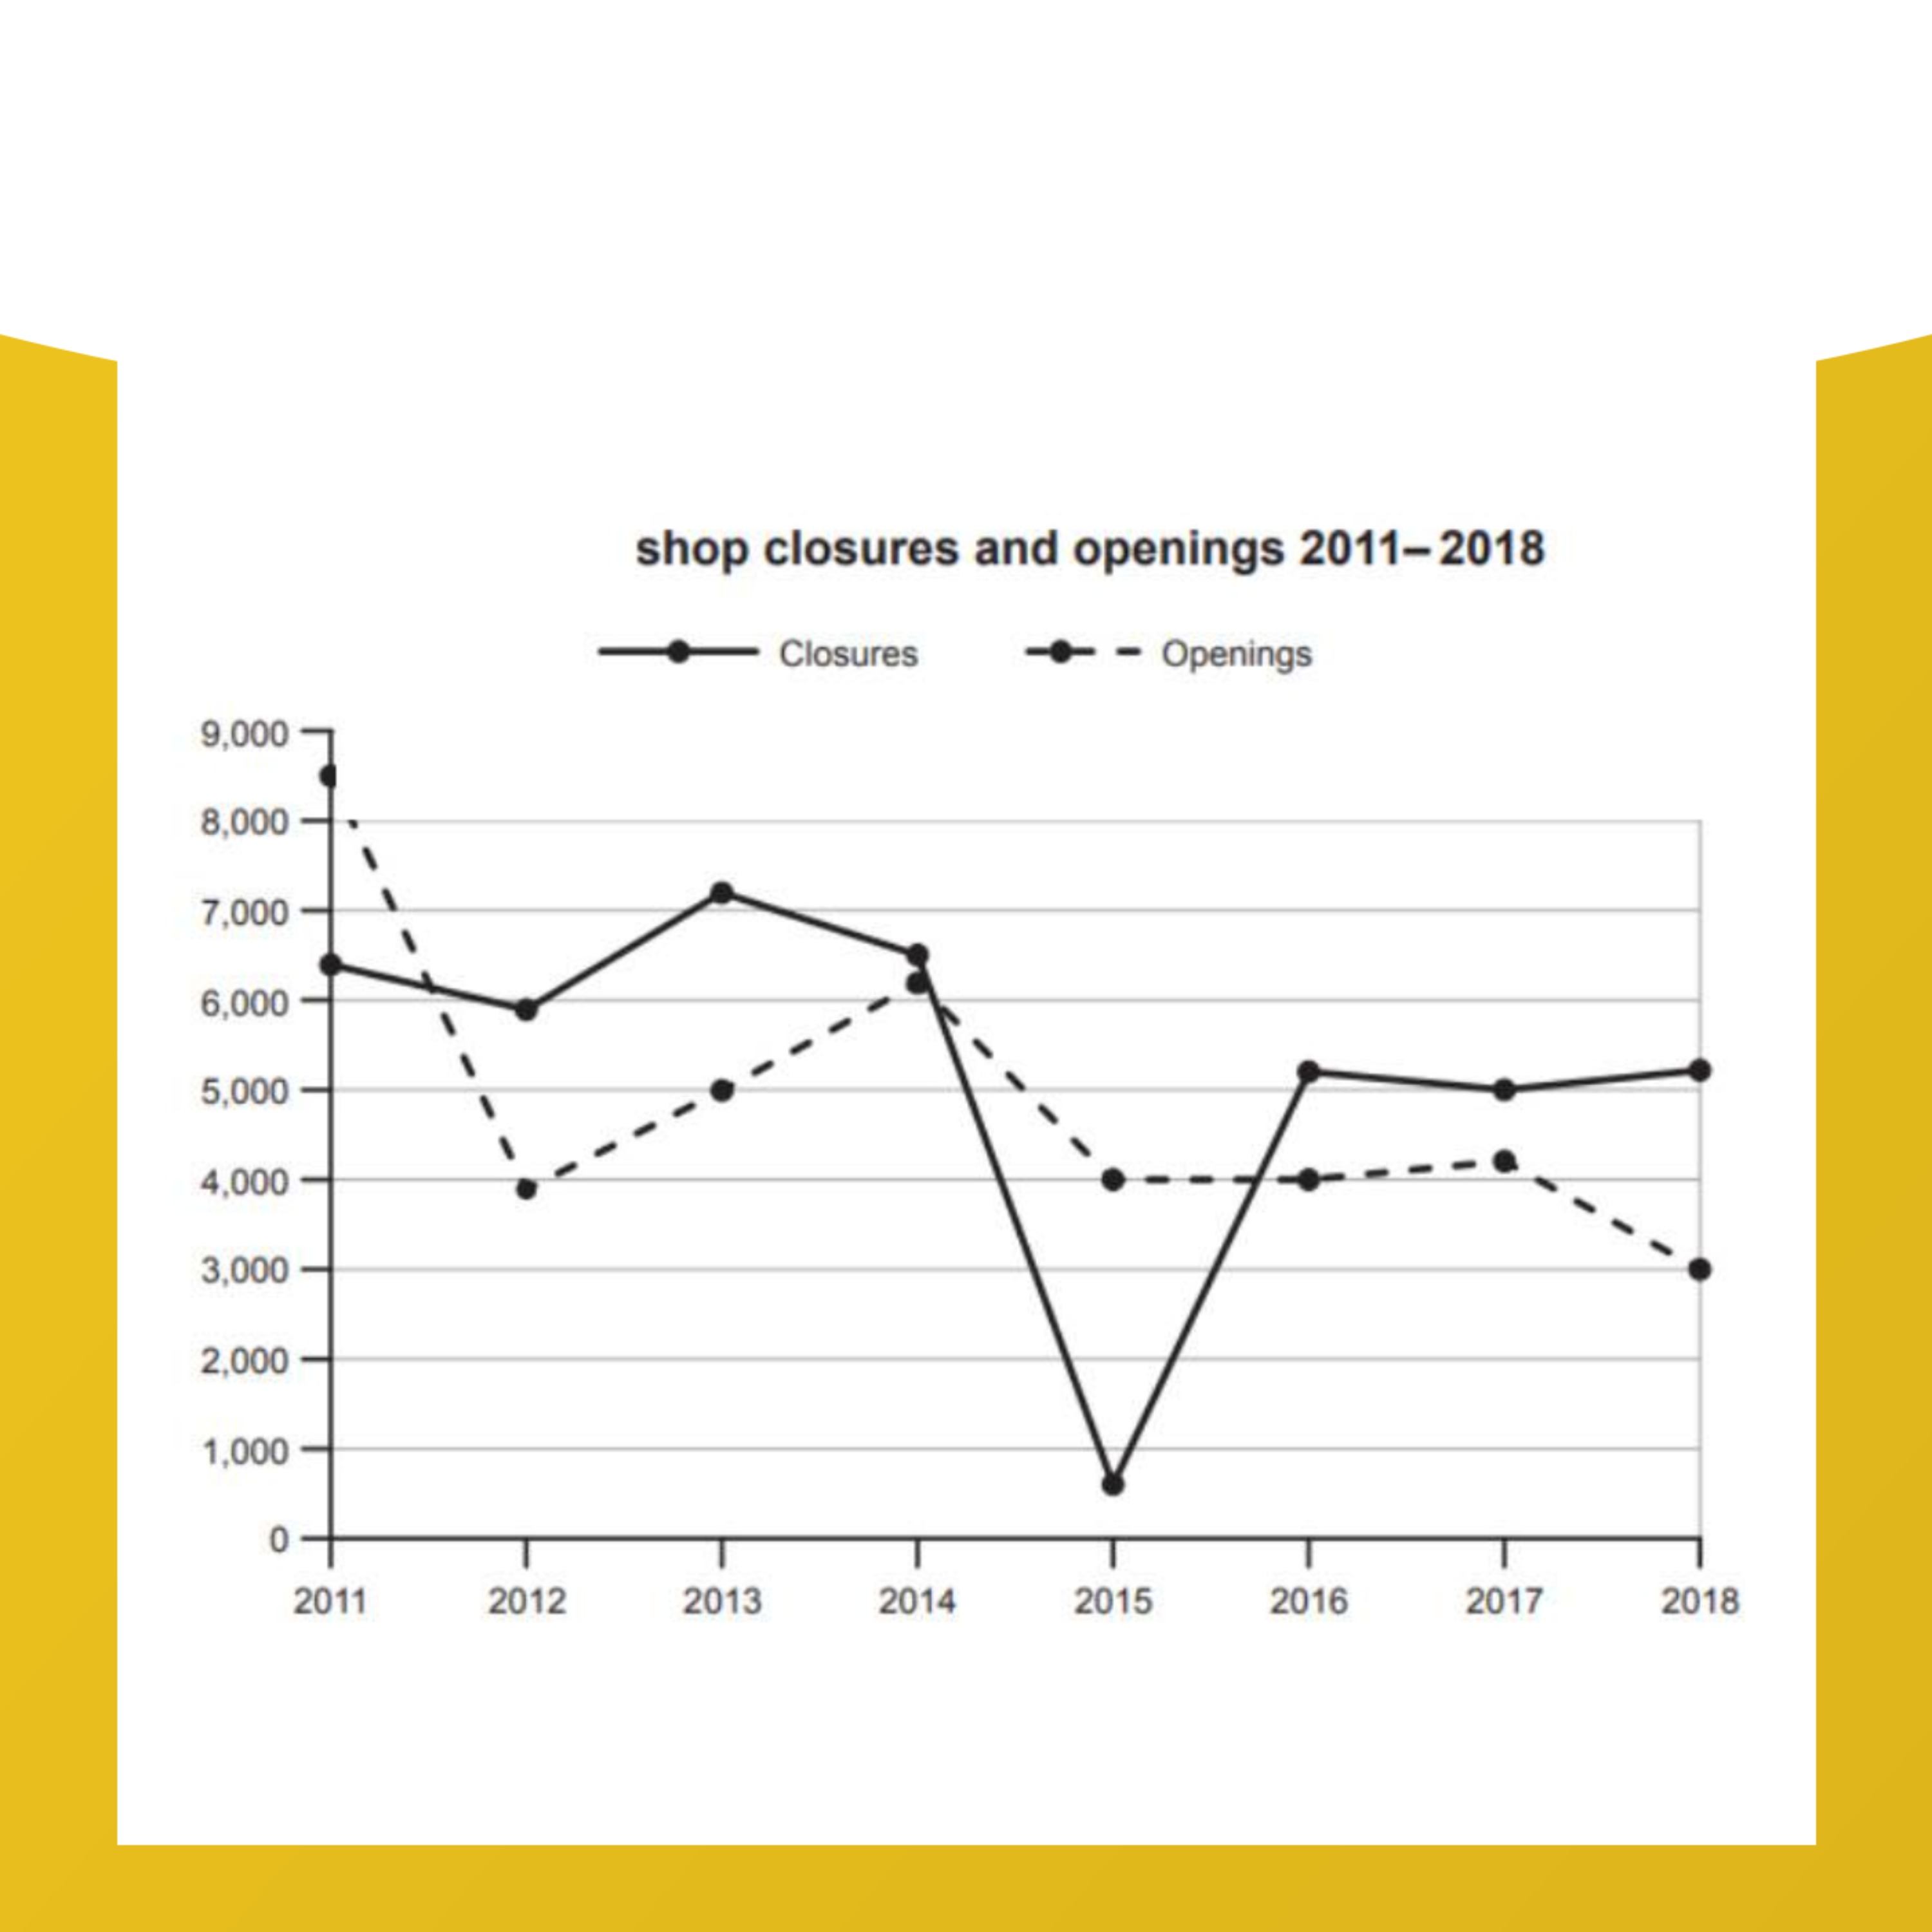
📊 Graph: Number of shops closures and openings between 2011 and 2018
Oct 25, 2022 - 4:22
📝 Task 2: Taking risks in professional and personal lives
Oct 5, 2022 - 8:32
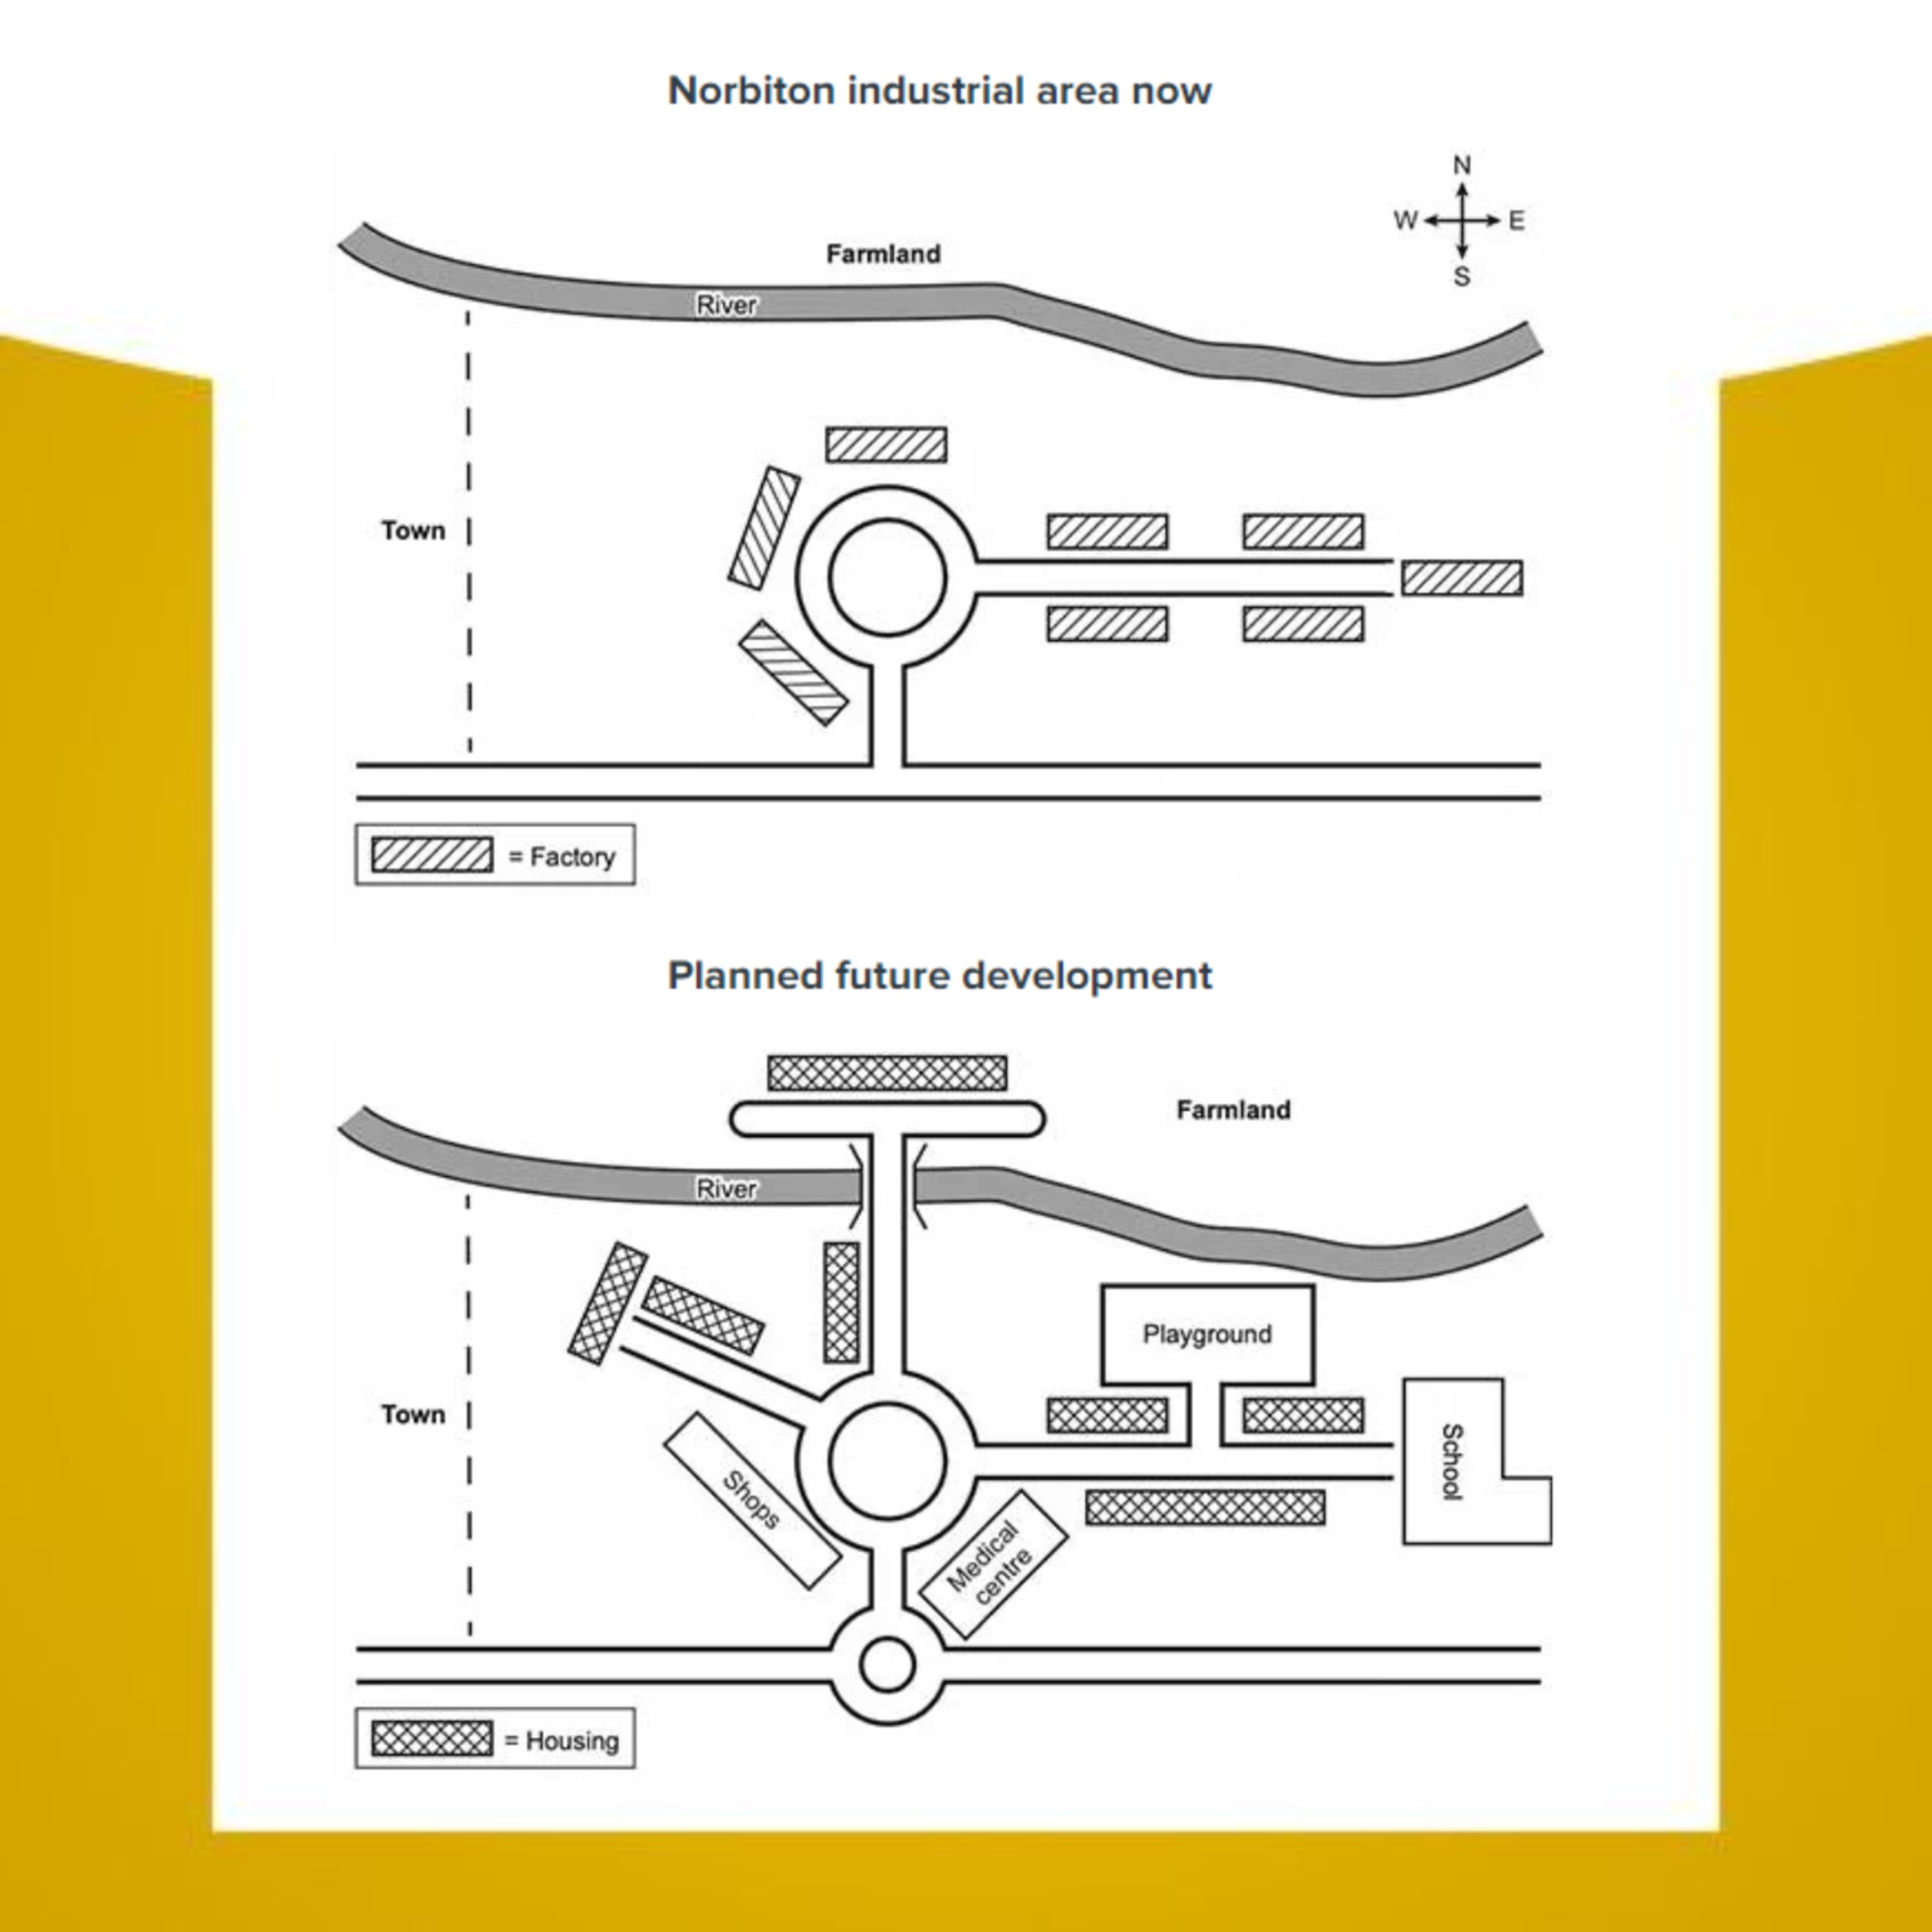
📊 Maps: Plans for future development of an industrial area in Norbiton
Sep 26, 2022 - 9:15